- 服务性能分析
服务性能分析
ghttp包提供了非常强大和简便的服务性能分析功能,内部完美集成了pprof性能分析工具,可以在任何时候通过EnablePprof方法启用性能分析特性,并可自定义性能分析工具页面路由地址,不传递路由地址时,默认URI地址为/debug/pprof。
我们来看一个简单的例子:
package mainimport ("github.com/gogf/gf/g/net/ghttp")func main() {s := ghttp.GetServer()s.EnablePprof()s.BindHandler("/", func(r *ghttp.Request){r.Response.Writeln("哈喽世界!")})s.SetPort(8199)s.Run()}
这个例子使用了s.EnablePprof()启用了性能分析,默认会自动注册以下几个路由规则:
/debug/pprof/*action/debug/pprof/cmdline/debug/pprof/profile/debug/pprof/symbol/debug/pprof/trace
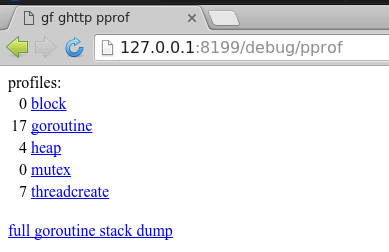
其中/debug/pprof/*action为页面访问的路由,其他几个地址为go tool pprof命令准备的。简单的性能分析我们直接访问/debug/pprof地址即可,内容如下:
pprof页面
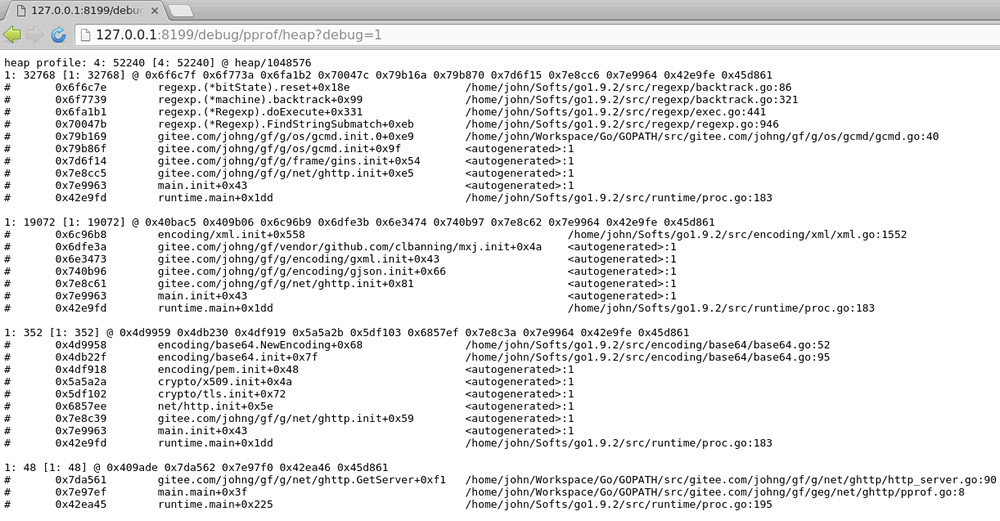
堆使用量
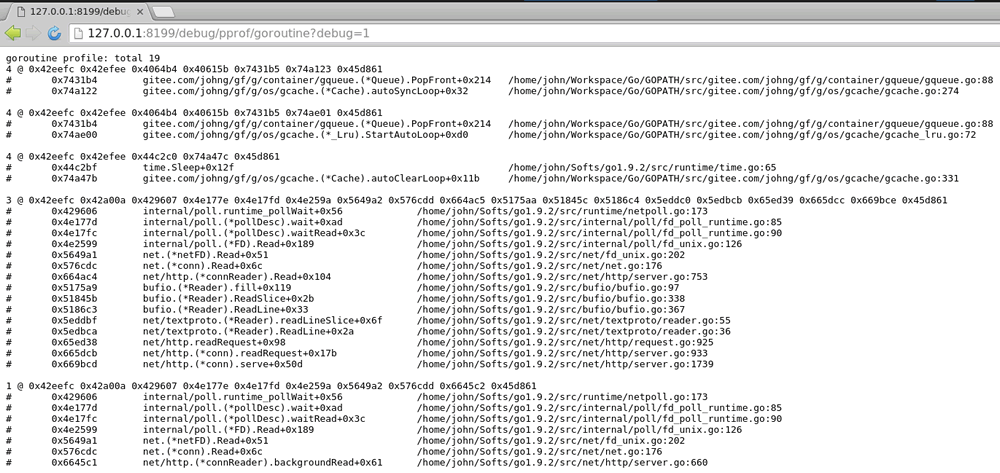
当前进程中的goroutine详情
如果想要进行详细的性能分析,基本上离不开go tool pprof命令行工具的支持,在开启性能分析支持后,我们可以使用以下命令执行性能采集分析:
go tool pprof "http://127.0.0.1:8199/debug/pprof/profile"
执行后pprof工具经过约30秒左右的接口信息采集(这30秒期间Web Server应当有流量进入,我们这里不停地访问hello world页面以作测试),然后生成性能分析报告,随后可以通过top10/web等pprof命令查看报告结果,更多命令可使用go tool pprof查看。关于pprof的详细使用介绍,请查看golang官方:blog.golang.org/profiling-go-programs
本示例中的命令行性能分析结果如下:
john@johnhome:~/Workspace/Go/gf$ go tool pprof "http://127.0.0.1:8199/debug/pprof/profile"Fetching profile over HTTP from http://127.0.0.1:8199/debug/pprof/profileSaved profile in /home/john/pprof/pprof.___go_build_pprof_go.samples.cpu.001.pb.gzFile: ___go_build_pprof_goType: cpuTime: Apr 17, 2018 at 10:53pm (CST)Duration: 30s, Total samples = 80ms ( 0.27%)Entering interactive mode (type "help" for commands, "o" for options)(pprof) top10Showing nodes accounting for 80ms, 100% of 80ms totalShowing top 10 nodes out of 49flat flat% sum% cum cum%10ms 12.50% 12.50% 10ms 12.50% github.com/gogf/gf/g/net/ghttp.(*Cookie).Get /home/john/Workspace/Go/GOPATH/src/github.com/gogf/gf/g/net/ghttp/http_server_cookie.go10ms 12.50% 25.00% 10ms 12.50% internal/poll.runtime_pollReset /home/john/Softs/go1.9.2/src/runtime/netpoll.go10ms 12.50% 37.50% 10ms 12.50% runtime.futex /home/john/Softs/go1.9.2/src/runtime/sys_linux_amd64.s10ms 12.50% 50.00% 10ms 12.50% runtime.getitab /home/john/Softs/go1.9.2/src/runtime/iface.go10ms 12.50% 62.50% 10ms 12.50% runtime.newarray /home/john/Softs/go1.9.2/src/runtime/slice.go10ms 12.50% 75.00% 10ms 12.50% runtime.rawstringtmp /home/john/Softs/go1.9.2/src/runtime/string.go10ms 12.50% 87.50% 10ms 12.50% runtime.usleep /home/john/Softs/go1.9.2/src/runtime/sys_linux_amd64.s10ms 12.50% 100% 10ms 12.50% sync.(*RWMutex).Lock /home/john/Softs/go1.9.2/src/sync/rwmutex.go0 0% 100% 10ms 12.50% bufio.(*Writer).Flush /home/john/Softs/go1.9.2/src/bufio/bufio.go0 0% 100% 10ms 12.50% github.com/gogf/gf/g/container/gqueue.(*Queue).PopFront /home/john/Workspace/Go/GOPATH/src/github.com/gogf/gf/g/container/gqueue/gqueue.go(pprof) webFailed to execute dot. Is Graphviz installed? Error: exec: "dot": executable file not found in $PATH(pprof) web(pprof)
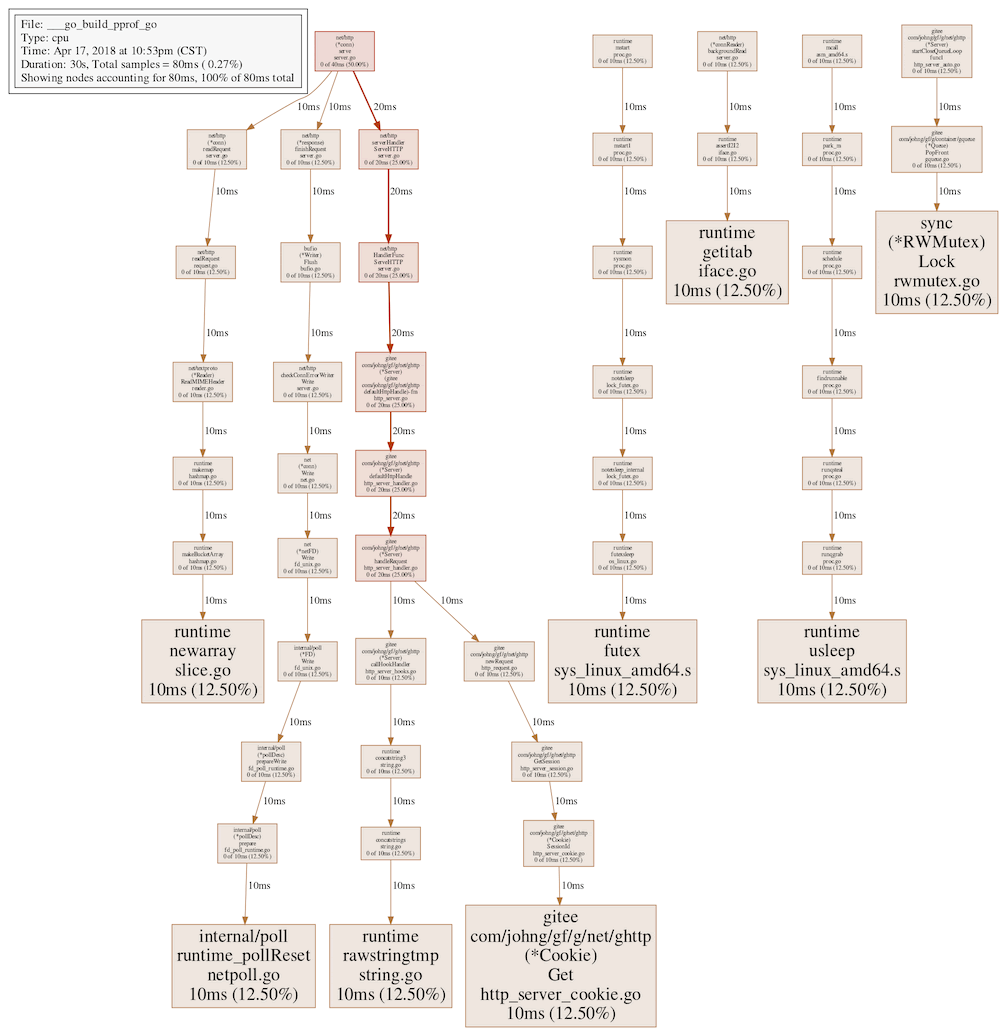
其中web命令用以图形展示接口之间的调用关系以及性能情况,但是需要安装Graphviz图形化工具,以我目前的系统为ubuntu为例,直接执行sudo apt-get install graphviz命令即可安装完成图形化工具,随后再次使用web命令,最终生成以下图表: